Free worksheet · AP Microeconomics Unit 3
A loss. Keep producing, or shut down?
Give students a competitive firm, three cost curves and a decision to defend. This one-page practice asks them to find output, shade the loss and explain the short-run choice.
One-page PDF. No account or email required. Worked answer below.
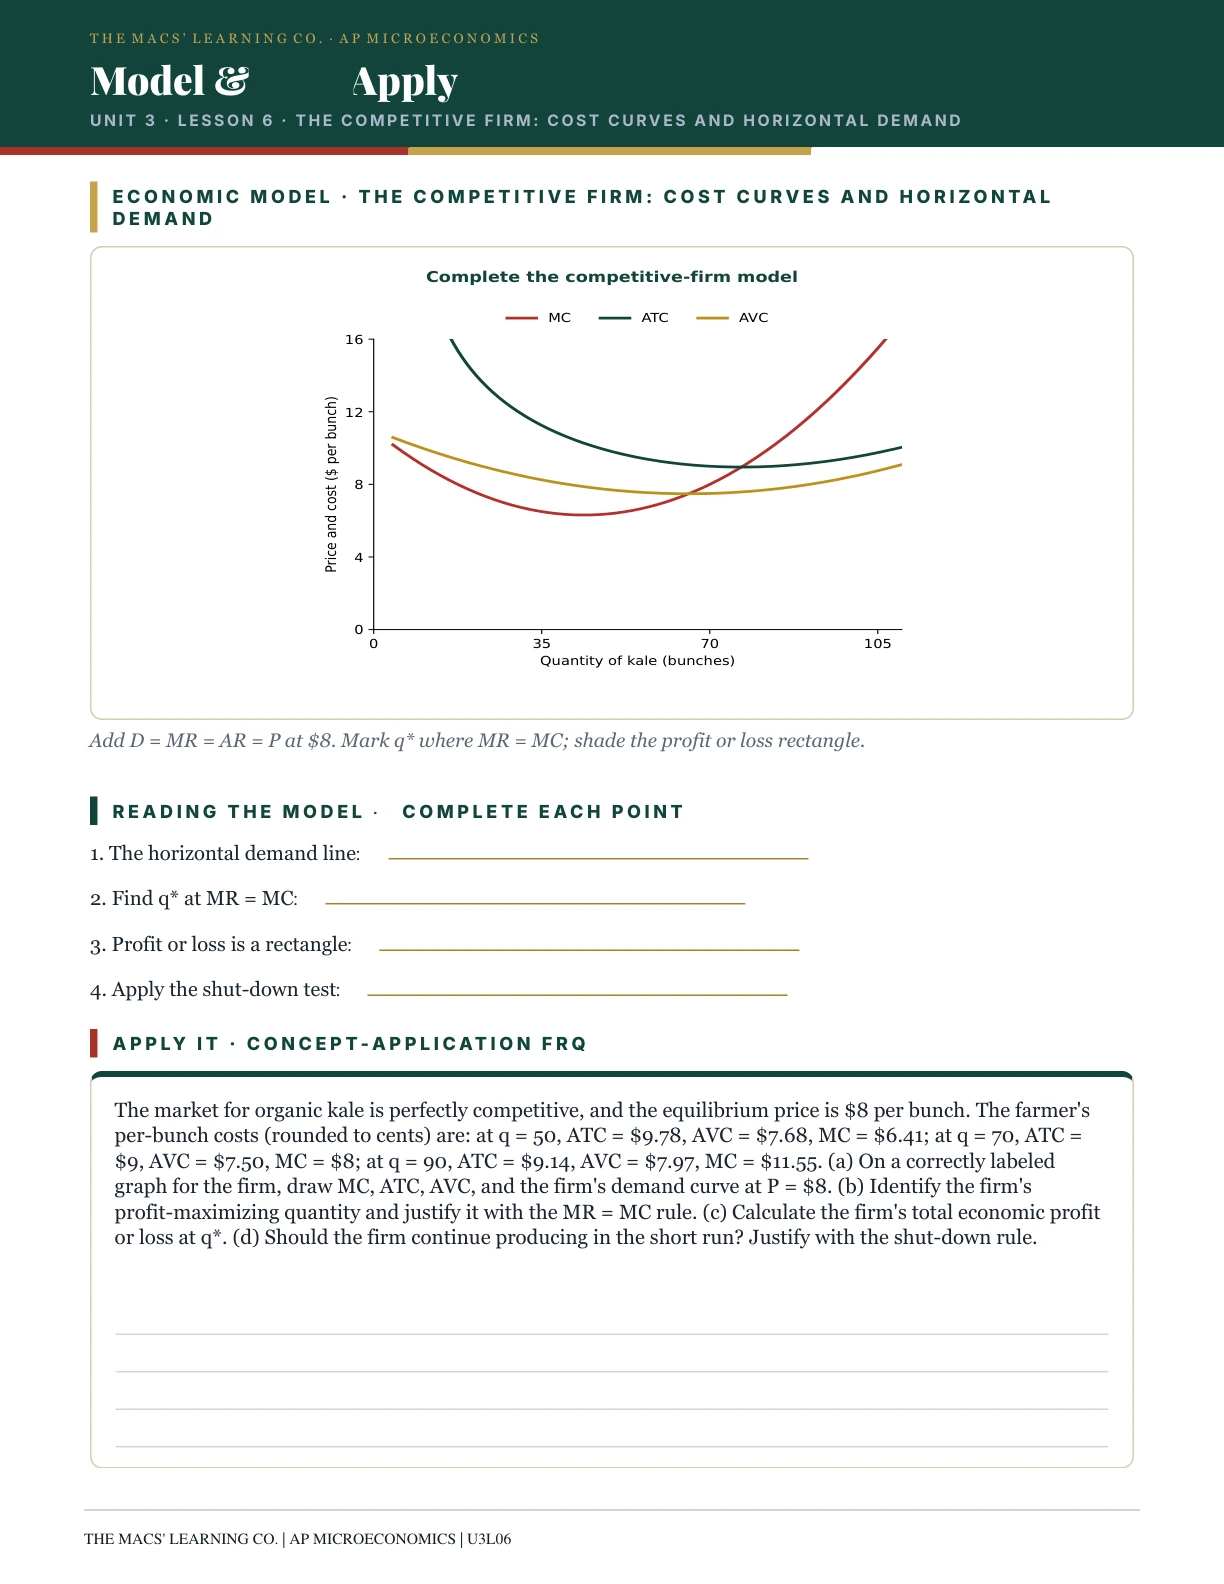
Decide before you reveal
A kale farmer faces a market price of $8.
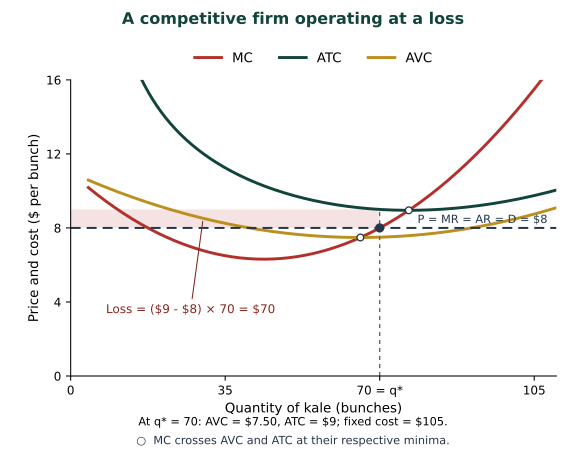
The market is perfectly competitive. At 70 bunches, marginal cost is $8, average variable cost is $7.50 and average total cost is $9.
Make the case
- Draw the firm's horizontal demand and marginal revenue line at $8.
- Mark the profit-maximizing quantity on the rising part of MC.
- Calculate total economic profit or loss. Shade it on the graph.
- Choose: produce or shut down in the short run? Defend your choice using AVC.
Before comparing answers, ask a partner: which cost can the farmer avoid by shutting down?
At 70 bunches
- Price = marginal revenue
- $8.00
- Marginal cost
- $8.00
- Average variable cost
- $7.50
- Average total cost
- $9.00
All values are per bunch. Total fixed cost is $105.
Reveal the worked answer
Produce 70 bunches and accept the $70 loss.
At 70, the horizontal MR line meets the rising MC curve. That is the relevant profit-maximizing intersection.
Profit = (price − ATC) × quantity = ($8 − $9) × 70 = −$70.
The firm covers its variable cost because $8 is above AVC of $7.50 at this output. Revenue of $560 pays $525 of variable cost and contributes $35 toward the $105 fixed cost.
Shutting down would leave the whole $105 fixed cost unpaid. Producing reduces the loss to $70.
Check the distinction: a loss means price is below ATC. Shutdown depends on whether price covers variable cost. In this short-run model, the shutdown threshold is minimum AVC; at exactly that price, producing and shutting down give the same loss.
Use it in your next lesson
A short practice with a useful disagreement.
Ask students to choose first, sketch independently, then compare their cost-based explanations. Reveal the worked answer after they have defended a choice. The most useful discussion is often why a firm can rationally keep producing while making a loss.
The PDF is a one-page excerpt from the student handout. It includes the cost curves, graph-completion directions and application question. It does not include the complete teaching deck or the rest of the unit.
See where this task fits in the ten-lesson Unit 3 teaching sequence, with pacing examples and a misconception guide.
Continue with the complete unit
Production, Cost & Perfect Competition
Ten lessons take students from marginal product and production costs to profit maximization, entry and exit, surplus, and market-and-firm graph practice.
Each lesson includes PDF slides, a student handout, an answer key, a lesson plan and an editable PowerPoint deck.
One-time digital download. Pay through Stripe, then open your resource library from the confirmation page or delivery email. Delivery and refunds.
AP is a registered trademark of the College Board, which was not involved in the production of, and does not endorse, this product.